Series 9: A Numbery-Wumbery Breakdown (Part 3)
Joshua Yetman presents a statistical breakdown of how Series 9 performed overall.
Welcome to the third and final part of our Numbery-Wumbery breakdown of Series 9, a trilogy of articles designed to provide a comprehensive examination of the statistics disseminated this year! Parts 1 and 2 focused on the community averages for Series 9 and how they compared to other series in the revival. Part 3, however, will depart from the opinions of the DWTV community and consider the far bigger picture, taking into account audience figures and AI figures. These two metrics are sampled from the British public, with the purpose of inferring the health and status of the show on a national scale. Whilst Series 9 performed excellently as far as the DWTV community is concerned, such a narrow range of opinions is immaterial to the BBC and the continuity of the show. No, to the BBC, audience figures and AI scores – among other things such as merchandising revenue, international presence, etc. – are effectively the electrocardiograph of the show, and indicate whether the show is performing healthily or starting to flatline.
The jargon and terminology of these metrics can sometimes be confusing, so allow me to give a brief explanation of some of the terms that will be used in this article.
The overnight audience refers to the amount of people who watched an episode live as it was broadcast or on the same day. The final audience refers to the overnight audience in addition to the amount of people who recorded and watched an episode within a week. The Live+7 audience – commonly abbreviated to L+7 audience – refers to the final audience in addition to the audience of any repeats, views accumulated on BBC iPlayer, etc., all within 7 days of initial broadcast. The audience share of an episode refers to the percentage of the entire television-watching audience at the time of broadcast that watched said episode.
The Audience Appreciation Index (AI for short) is a score out of 100 which is used as an indicator of the public’s appreciation for a show. Panels of about 10,000 people are currently surveyed. AI scores can be differentiated by demographics (specifically age and gender), but only a single consolidated figure is taken as the “official” AI score.
(9) Overviewing the audience figures
For Series 9:
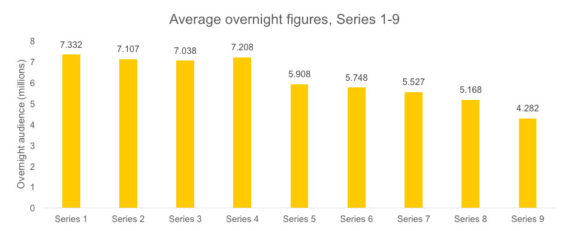
- The average overnight audience was 4.282 million, peaking at 4.85 million for The Girl Who Died (likely down to the “Maisie Williams effect”) and dipping to 3.70 million for The Witch’s Familiar (which had suffered due to its placement against a Rugby World Cup match).
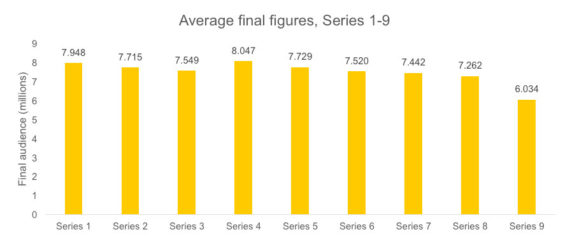
- The average final audience figure was 6.034 million, again peaking for The Girl Who Died (at 6.560 million) and dipping to 5.610 million for Sleep No More. All the final figures were very consistent, indicating that the show had a large, fairly loyal audience this year.
- L+7 figures are currently incomplete, but the first seven episodes of the series (from The Magician’s Apprentice to The Zygon Invasion) had an average L+7 audience figure of 6.811 million. It is currently unknown when the remaining five figures will be published. Because finales tend to experience a ratings boom, it is probably safe to say the final L+7 figure will be higher.
- When it comes to the overnight audience, Series 9 commanded an average 19.6% share of the audience.
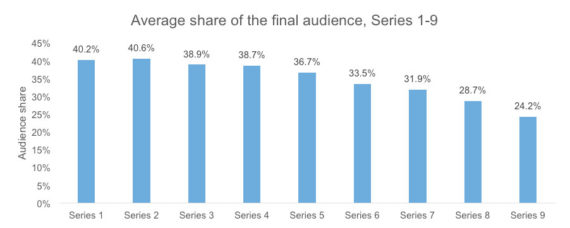
- When it comes to the final figures, Series 9 commanded an average 24.2% share of the audience.
- As far as BBC data is available (only until The Woman Who Lived), the Series 9 audience was 51% male and 49% female on average.
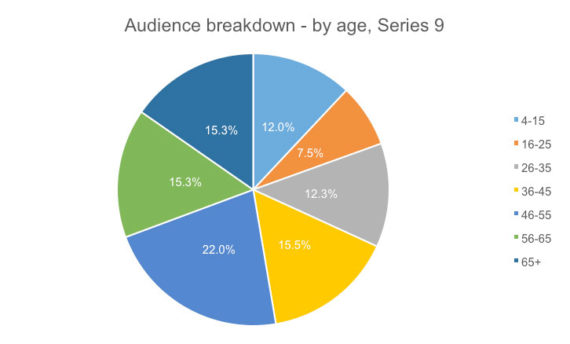
- The audience this year had an average age of 45.5 years, a figure I calculated from given BBC figures. For reference, it was 43.7 last year, indicating a maturity of the audience greater than the accumulation of a birthday. The full demographic break down of the age of the audience this year can be seen below:
- The data goes into so much detail that you can actually differentiate the audience based on socioeconomic class! According to said data, an average of 32% of the Series 9 audience were from a middle class background, 46% came from a lower middle class background or skilled working class background, and 22% came from a lower working class or non-working background. Socioeconomics are not my area, so make of this what you will. All I’ll say is, looking at the data patterns over the past 10 years, the middle class element has been increasing ever so slightly.
- All in all, 61% of the L+7 audience of Series 9 (as far as such data is available) came from a TV source, and 39% came from a non-TV source.
- Fun fact – during this series, the aggregate final audience figures of the whole revival broke one billion!
(10) Analysis and comparison of the audience figures
Television has evolved over the last 10 years. It’s had to, what with the internet creating some formidable competition. In order to compete, television has become more convenient, with the number of ways to watch – and, more importantly, catch up on television – having exploded exponentially in recent times.
Though watching television live as it is being broadcast is far from becoming an archaic practice, and many shows – usually talent shows or sporting events – still pick up a huge live audience (which makes sense – these kind of programmes carry iconic moments, like the victory of another dead-end popstar or a nailbiting football final which people want to see live), there has been a distinct move to catchup viewing for other shows, especially drama shows.
Why? Well, it’s not always a priority for people to watch such shows live, and due to the aforementioned abundance of ways to catch up these days (iPlayer, ITV player, DVR, repeats, etc.) on so many devices (on tablets, phones and more), it is often the more practical option. We have evidence to support this claim – this year, as it states in section (9), 61% of the L+7 audience came from a TV source, and 39% came from a non-TV source. Last year alone, 66% of the ultimate audience came from a TV source, and 34% came from a non-TV source, indicating a significant shift in just 12 months.
Doctor Who has experienced falling overnight figures for years now. Just look at the following diagram (which excludes all specials, which are ratings juggernauts and so would skew the results considerably):
With the exception of Series 4, they have been falling consistently, in fact, with a noticeably sharp drop this year.
Ultimately, overnights are not important, representing only a part of the actual audience, especially in recent years due to the aforesaid transition to catch-up viewing. However, I feel this systemic, macroscopic explanation doesn’t quite explain everything with Series 9’s low overnight results.
Capaldi himself believes the show this year was being “used as pawn in Saturday night warfare” and was being aired far too late for the younger demographics (though the 4-15 demographic only fell by 1% ultimately compared to last series), and Moffat singled out the lack of something new, i.e. a new Doctor (perish the thought) or new companion as a contributing factor to the reduced figures, meaning the show lacked the “kick” to attract some casual audience members. The show also had to compete with some very popular programming, such as The X Factor and, for the first few episodes, the Rugby World Cup. As I said earlier, talent shows and sporting events command large overnight audiences, drawing the overnight audience away from shows like Doctor Who which did suffer somewhat, especially The Witch’s Familiar and Under the Lake.
The Rugby World Cup was a one-off event (well…a one in four years event, to be precise), but the competition across channels and the sporadic timetabling of Series 9 dictated by Strictly Come Dancing is perhaps indicative that the Autumn schedule is unsustainable for the show, and it could benefit from moving back to a Spring schedule (which might end up being the case, given the paucity of information on Series 10) where the competition is more scarce.
Anyway, none of this matters if the final figures – a more accurate and reflective measure of the audience (though not as accurate or reflective as the L+7 figures) – regain the “lost” overnight figures. Let’s now take a look at the final figures across the revival:
Compared to the overnights, the final figures are a lot more stable, indicating that the overall audience has ultimately stayed pretty much the same over the past 10 years, with the exception of Series 9 which is notably down. Series 8 was a bit down as well. Seeing as the Autumn broadcast window started with Series 8, this perhaps gives evidence to the theory that the decision to air the show in Autumn truly has had a detrimental effect on the series.
Doctor Who’s share of the final audience has also been steadily decreasing over the past few years:
Series 9 has had the lowest average share of the final audience in the revival, but it should be stressed that a 24% audience share is still far from poor. A quarter of the whole TV audience watching the show cannot be connotated in a bad light whatsoever. Nevertheless, this diagram shows that we cannot blame the reduced audience figures on an endemic fall in television viewing full stop; if that was the case, and there were no other problems with the show, we’d expect the above audience shares to be relatively constant. No, these diagrams instead show that the problem (if you want to call it a problem), whatever it is, does lie with the show itself, as the audience figures and the audience shares have both been falling.
However, the truest and most accurate metric of the audience is the L+7 measure, which is available for all of Series 8 and, so far, the first seven episodes of Series 9. Series 8 had an average L+7 audience figure of 8.408 million (probably because of the advent of the new Doctor and the buzz such an iconic moment generates). Series 9 is considerably down on that figure, at 6.811 million.
So we can reasonably conclude that the audience figures are down this year. That much seems very evident whichever way you cut it. There are a variety of possible reasons, be it heavy competition from other shows in the Autumnal broadcasting window, a detrimental late and sporadic broadcast time, the lack of something new to attract the casual audience, whatever it may be, the figures are down.
But does it really matter? No. Too often do we consider things relatively, and not on their own absolute merits. Too often do we compare something to other things, to contexutalise it, when just looking at the results on their own can yield just as much information. Too often does the bigger picture distract us from the key results. I’m guilty of this with the premise of this very trilogy of articles which is comparing things left right and centre, but I have consistently tried to emphasise that something can stand proudly as it is.
The audience figures are down, but are they bad numbers? No. The final measure indicates that 6.034 million watched Series 9. That is not a bad figure. Even better, the L+7 measure indicates that 6.811 million watched Series 9. That is definitely not a bad figure. 24% of the total audience watching TV were watching Series 9. That is not a bad figure.
Of course, the trend could continue, and the figures could fall further. I doubt that, as Series 10 will feature a new companion and, potentially, a shift to a Spring window, which would boost the ratings considerably. Still, that is neither here nor there when it comes to Series 9. We’ll have to wait and see the results of Series 10, but, as it stands purely for Series 9 on its own, it does not have bad results and the hysteria and cynicism surrounding them is unjustified and overdramatised.
And, finally, notice how, throughout this section, I did not attribute the fall in audience figures or audience shares to the perceived quality of the series itself. Analysis of figures like these is a subjective affair, but I have no reason to suspect that the quality of the show has been putting people off, especially seeing as the AI scores – the focus of the next section – show that Series 9 was perceived as performing very well. I feel the explanations I, Moffat and Capaldi have given are far more influential in this matter.
(11) The AI scores
The average AI score for Series 9 was 82.25. This is lower than the Series 8 average of 83.23, but it is still a very healthy figure in its own right, given that it is close to 85, the BBC benchmark for “excellent” programming. The score indicates that the vast majority of respondents voiced highly positive opinions over the show in its current state, although the order of quality implied by the scores does differ significantly from the DWTV consensus (like Heaven Sent being the second worst episode of the series to the AI panel, whilst being the best to the DWTV community). It should also be noted that this AI average should not be compared to the AI averages of earlier series, as there was a change in methodology in 2012 which makes comparisons unbalanced.
The highest AI score achieved this year was 84, achieved by four episodes (The Magician’s Apprentice, Under the Lake, The Zygon Inversion and Face The Raven). The lowest AI achieved this year was 78, received by Sleep No More.
Breaking down the AI panel into age groups, the 16-34 age group were the most positive about Series 9. This group gave the series an average AI of 84.3, with their highest score given to The Magician’s Apprentice at 87 (the highest demographic AI recorded this year) and their lowest score given to Sleep No More at 80. The least positive age group were the 55+ group, who gave an average AI of 81, with their highest score of 83 given to Under the Lake and their lowest score of 76 given – shockingly – to Heaven Sent. The 35-54 age group were in the middle giving an average AI score of 82.5. This lot liked Face The Raven the most (at 85) and Sleep No More the least (at 79). Lastly, Heaven Sent certainly split the age groups; the over 55’s gave it an average of 76, whilst the 16-34 group gave it an average of 85!
Differentiating by gender, female panel members were slightly more positive than male members, the former giving an average 82.9 compared to the latter’s average of 82.
[Source of data: doctorwhonews.net]
(12) Conclusion
We have finally come to the conclusion of this trilogy of articles, and I sincerely hope you’ve enjoyed the ride. We’ve considered average scores, divisiveness, consistency, projections, eras, best writers, audience figures and AI scores in order to give a comprehensive summary of everything statistical that happened this year. Providing you don’t all tire with me, I’d be happy to do this kind of thing after every series.
When you compare all the Series 9 results to other series, it has done exceptionally well indeed. But – more importantly, as I’ve emphasised in this article in particular – it has done brilliantly on its own individual merits. It’s been a statistically profitable year, and the legacy of Series 9 is one I feel will be felt for many years to come.


