Series 9: A Numbery-Wumbery Breakdown (Part 2)
Joshua Yetman presents a statistical breakdown of how Series 9 performed overall.

Welcome to part 2 of our Numbery-Wumbery breakdown of Series 9, a trilogy of articles designed to provide a comprehensive and hopefully interesting examination and surmising of the statistics disseminated this year! Part 1 looked at the key results of Series 9 and compared its average score to that of other series in the revival. This article will continue in its foray into the numbery depths of the series and consider the divisiveness and consistency of Series 9, and how the revived era currently stands subsequent to the conclusion of Series 9.
(5) Considering the divisiveness of each series
Much like we did in part 1, we can infer the divisiveness of a series by calculating the standard deviation of the “average” episode in said series. How does Series 9, with its average divisiveness of 2.197 as stated in part 1, fare against the rest of the revival in this regard? Well the full rankings are as such:
- Series 4 – 1.938 (least divisive)
- Series 5 – 1.994
- Series 1 – 2.056
- Series 7 – 2.087
- Series 8 – 2.103
- Series 3 – 2.144
- Series 9 – 2.197
- Series 6 – 2.257
- Series 2 – 2.405 (most divisive)
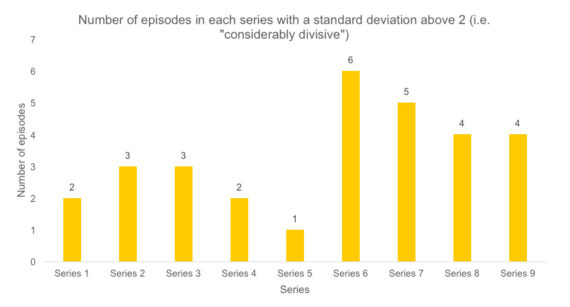
Series 9, then, doesn’t perform particularly well here, becoming the third most divisive series of the revival. This is partly due to the unfortunate fact that Series 9 possesses the two most divisive episodes of the whole revival (Hell Bent and Sleep No More), which have significantly pushed it down the divisiveness rankings. Four episodes had a standard deviation above 2 (the threshold for an episode to be “considerably divisive” in my interpretation of the scores). For comparison purposes, the number of episodes with a standard deviation above 2 in each series is highlighted in the following diagram:
Interestingly, with the exception of Series 5, it seems the RTD era had far fewer considerably divisive episodes than the Moffat era. The remarkably polarizing Series 6 naturally dominates this particular measure, with nearly half of its episodes being regarded as considerably divisive as per its definition.
(6) Considering the consistency of each series
Consistency is not a statistic I included in the Your Verdict On articles, as it only makes practical sense to calculate it when you have a complete series, as a single episode can throw out the results completely.
So what is consistency? Consistency is all about well…consistency. Has the series been up and down like a yoyo, or has it been smooth sailing from the get-go? Consistency is calculated similarly to divisiveness, i.e. through standard deviation (specifically, taking the standard deviation of all the episode averages; the higher the figure, the less consistent the series was), but it is important to note that they are completely different statistics. The divisiveness of a series is the average standard deviation, whilst consistency is the standard deviation of the averages.
So how consistent was Series 9? Well, the standard deviation of all the episode averages is 0.885. The figure on its own is pretty meaningless, however, and requires context. Thus, presented below is the full consistency rankings of all the series in the revival:
- Series 7 – 0.624 (most consistent)
- Series 4 – 0.775
- Series 9 – 0.885
- Series 5 – 0.983
- Series 8 – 1.081
- Series 6 – 1.086
- Series 1 – 1.131
- Series 3 – 1.198
- Series 2 – 1.474 (least consistent)
So Series 9 is the third most consistent series, after Series 4 and – rather interestingly – Series 7. Of course, just because a series is consistent doesn’t mean it was a good series. It could just be consistently awful, for example. Though “consistently awful” is too strong a description for the Series 7 community averages, it’s pretty fair to say it was a consistently average series in the eyes of the community, hence explaining why it tops this list. Series 2 rather expectedly sits at the bottom due to the fact it has the two lowest rated episodes of the revival, Love & Monsters and Fear Her, along with such acclaimed masterpieces like The Girl in the Fireplace, meaning that it was an remarkably up-and-down series.
(7) Considering the whole revival and particular eras
Before Series 9, the revival average was 7.505. Now it stands at a higher 7.567, thanks to Series 9.
If you ordered all of the 129 episodes in the revival from best to worst, you will find the remarkable result that the entire top ten episodes are written or co-written by Moffat, a testament to his writing brilliance (his current writing average is 8.306 as well, making him one of the most acclaimed writers of the revival). You will also find the perhaps less interesting – but certainly not unimportant – result that 2010’s The Lodger is right in the middle of the rankings (with a score of 7.688), thus making it the new median episode (before Series 9 it was Time Heist).
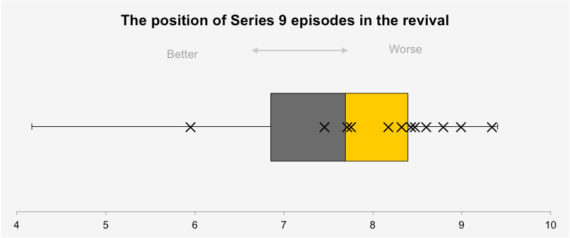
Now, imagine that you split these ordered rankings into quarters. Quarter 1 consists of the bottom 25% of episodes, Quarter 2 consists of the next 25% of episodes, etc. The boundary of Quarter 1 and Quarter 2 is what we call the lower quartile, and the boundary of Quarter 3 and Quarter 4 is what we call the upper quartile (the boundary of Quarters 2 and 3 is the median). In the revival, the lower quartile episode is now Cold War at 6.852, and the upper quartile episode is now Bad Wolf at 8.397.
From these results, we can construct a box-and-whisker diagram, which illustrates each quarter diagrammatically. In the diagram below, the grey box is the lower quartile range (the gap between the lower quartile and the median, i.e. Cold War and The Lodger), the yellow box is the upper quartile range (the gap between the median and the upper quartile, i.e. The Lodger and Bad Wolf), and the whiskers represent the top 25% and bottom 25%. Plotted on this diagram is each and every Series 9 episode, demarcated by a black cross:
So a remarkable 6 episodes of Series 9 fall on the upper whisker, and, thus, half of Series 9 falls in the top 25% of the revival. A further 4 episodes lie in the upper quartile range (and so 10 episodes in total lie in the top 50% of the revival). Sleep No More is the only episode to fall on the lower whisker.
Moving on, an interesting fact about this series is that, during it (specifically after Under the Lake), the Moffat era overtook the RTD era in episodes. As it currently stands, Moffat has executively produced 69 episodes compared to RTD’s 60 episodes. The Moffat era average has soared to 7.645 from 7.534. The RTD era average remains at 7.477. A Hypothesis test could be used to make inferences about the difference in quality between the two eras, which I have done in the past, but I think the conclusions they would make now would lead to some resoundingly unpleasant discussion, and so I will not include that here.
Lastly, the average of Capaldi’s era currently stands at 7.925, considerably higher than the other Doctors of the revival. To form a ranking of the eras of each Doctor:
- Twelfth Doctor – 7.925
- Ninth Doctor – 7.587
- Eleventh Doctor – 7.486
- Tenth Doctor – 7.446
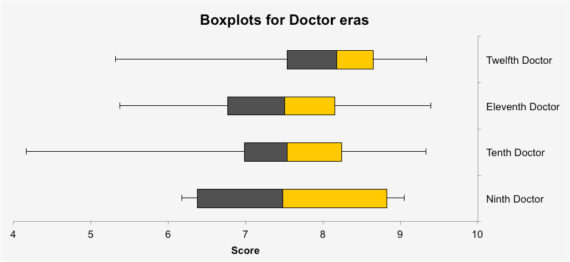
For added information, a boxplot for each Doctor’s era – encoding a similar kind of information as the boxplot above – is presented below:
So, by considering the above diagram, it seems that Capaldi’s era is distinctly “shifted” to the right when compared to his two immediate predecessors. It even seems that the median Capaldi episode is about as good as the upper quartile Smith episode, thus implying that 50% of Capaldi’s era is better than 75% of Smith’s era (and similarly for Tennant’s era).
(8) Best Series 9 writer
Series 9 was created through the writing talent of 7 remarkable individuals, including current showrunner Steven Moffat. So, according to the averages, which writer produced the best content this series? The rankings are as such (note: for co-written episodes, the average is allocated to both writers involved):
- Sarah Dollard [Face The Raven] – 8.800
- Peter Harness [The Zygon Invasion, The Zygon Inversion (cw)] – 8.659
- Steven Moffat [The Magician’s Apprentice, The Witch’s Familiar, The Girl Who Died (cw), The Zygon Inversion (cw), Heaven Sent, Hell Bent] – 8.440 (8.547 excluding co-writes)
- Toby Whithouse [Under the Lake, Before the Flood] – 8.308
- Catherine Tregenna [The Woman Who Lived] – 7.715
- Jamie Mathieson [The Girl Who Died (cw)] – 7.461
- Mark Gatiss [Sleep No More] – 5.955
[cw = co-written]
This is not a particularly fair list, as the success of The Zygon Inversion – which is the primary reason for Harness’ high placement – is mostly attributable to Moffat’s contribution to said episode (the iconic anti-war speech). Regardless, however, Sarah Dollard’s acclaimed episode Face The Raven tops this list. Perhaps it was the emotion and beauty of Clara’s exit in the episode, or perhaps the bulk of the community truly found something special in Dollard’s magical, Harry Potter-esque script, but she holds the crown as being the best writer of the series (as far as the averages are concerned).
Jamie Mathieson falters in the list, a significant deviation from last year when he dominated Series 8 and become its best writer. Poor Mark Gatiss, however, takes the very last spot on this list due to his poorly received Sleep No More. One day, Mark, you’ll top this list. One day, I hope.
And thus we conclude part 2 of this trilogy of articles. Join us for the final part of the trilogy where we will consider something other than the DWTV averages: the audience figures and the AI figures, split into demographic categories. Here we will come to the ultimate conclusion of a question burning through the community: are the ratings actually falling and, if they are, does it matter? Tune in to find out!


